

Latest weekly Covid-19 rates for local authority areas in London
Register for free to read more of the latest local news. It's easy and will only take a moment.
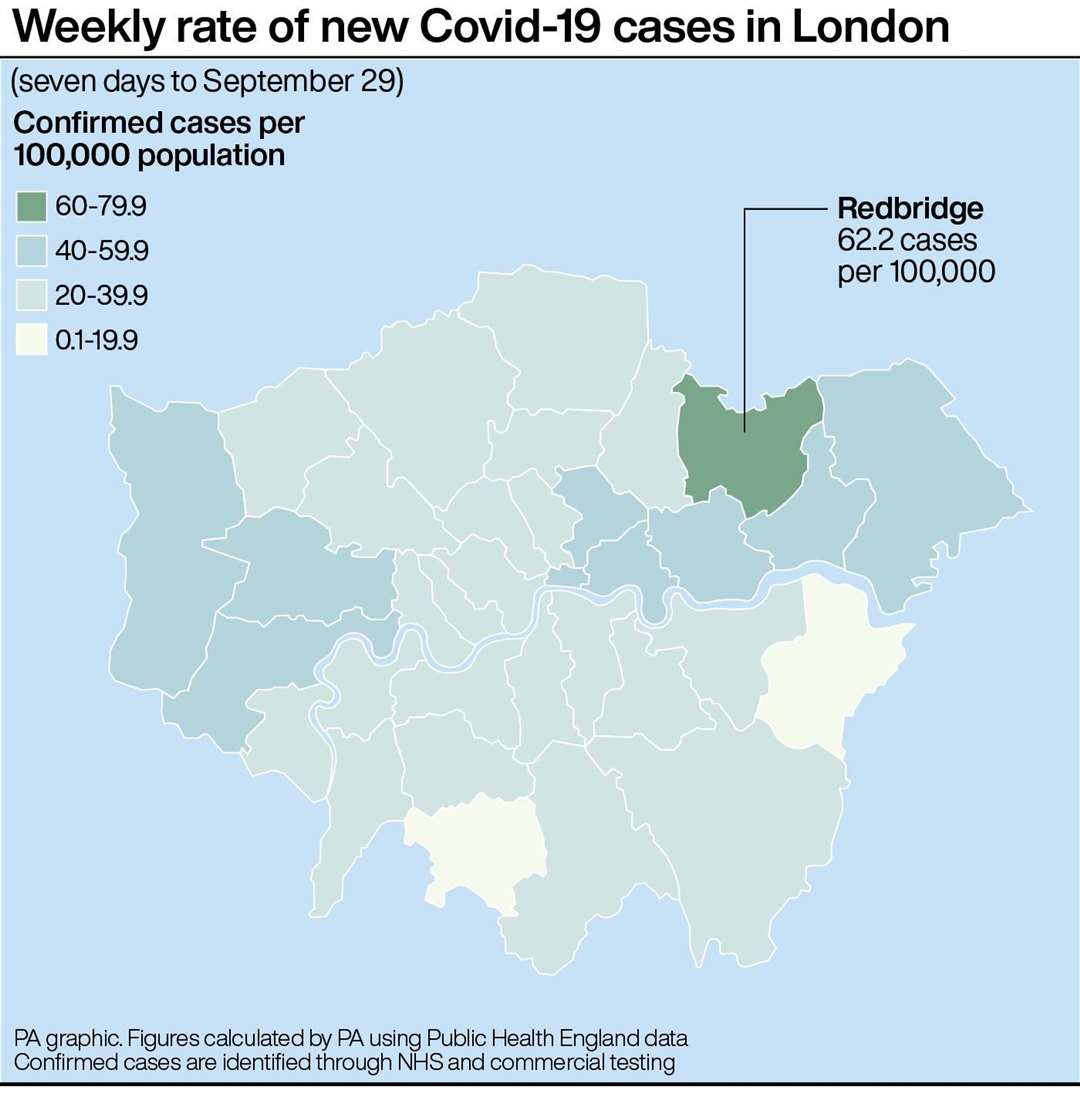
Here are the latest weekly rates of new cases of Covid-19 for every local authority area in London.
The figures, for the seven days to September 29, are based on tests carried out in laboratories (pillar one of the Government’s testing programme) and in the wider community (pillar two).
The rate is expressed as the number of new cases per 100,000 people.
Data for the most recent three days – September 30 to October 2 – has been excluded as it is incomplete and likely to be revised.
The list has been calculated by the PA news agency and is based on Public Health England data published on October 2 on the Government’s coronavirus dashboard.
Here is the list in full. From left to right, it reads: name of local authority; rate of new cases in the seven days to September 29; number (in brackets) of new cases recorded in the seven days to September 29; rate of new cases in the seven days to September 22; number (in brackets) of new cases recorded in the seven days to September 22.
Redbridge 62.2 (190), 57.7 (176)
Newham 53.8 (190), 41.1 (145)
Hounslow 50.8 (138), 29.5 (80)
Havering 48.5 (126), 38.5 (100)
Barking and Dagenham 48.4 (103), 55.0 (117)
Ealing 47.1 (161), 35.4 (121)
Hackney and City of London 44.0 (128), 25.8 (75)
Hillingdon 42.0 (129), 39.4 (121)
Tower Hamlets 40.3 (131), 45.9 (149)
Brent 39.7 (131), 34.0 (112)
Hammersmith and Fulham 38.3 (71), 27.0 (50)
Enfield 37.4 (125), 30.9 (103)
Richmond upon Thames 36.9 (73), 16.7 (33)
Islington 35.5 (86), 31.8 (77)
Haringey 34.6 (93), 31.6 (85)
Harrow 34.2 (86), 31.1 (78)
Barnet 33.3 (132), 27.8 (110)
Waltham Forest 33.2 (92), 39.0 (108)
Southwark 31.7 (101), 34.8 (111)
Kingston upon Thames 29.3 (52), 23.1 (41)
Greenwich 27.8 (80), 22.2 (64)
Wandsworth 27.3 (90), 27.6 (91)
Lambeth 27.3 (89), 26.4 (86)
Croydon 25.9 (100), 18.6 (72)
Kensington and Chelsea 25.6 (40), 21.1 (33)
Westminster 24.9 (65), 24.9 (65)
Lewisham 24.2 (74), 20.6 (63)
Merton 22.8 (47), 15.5 (32)
Bromley 21.1 (70), 18.4 (61)
Camden 20.4 (55), 22.2 (60)
Bexley 19.3 (48), 29.0 (72)
Sutton 16.0 (33), 22.3 (46)